The Ultimate Prop Firm Comparison: Fees, Profit Splits, Execution, and What Really Matters
This long-form guide gives traders a repeatable framework to compare proprietary trading firms across the metrics that affect your bottom line: fees, profit splits, execution, drawdown rules, payout mechanics, instrument coverage and scaling paths. Use this to shortlist firms, run simple profitability models, and pick a partner that fits your edge.
Why a rigorous comparison matters
Headline metrics like “80/20 profit split” or “instant funding” are attention-grabbing, but they hide the true drivers of trader take-home profit. Two firms with the same headline split can produce drastically different outcomes once fees, execution, drawdown rules and payout reliability are included. This guide teaches you to look under the hood and quantify differences so your decision is based on expected net profit and strategy fit - not marketing.
Key metrics to compare (the short list)
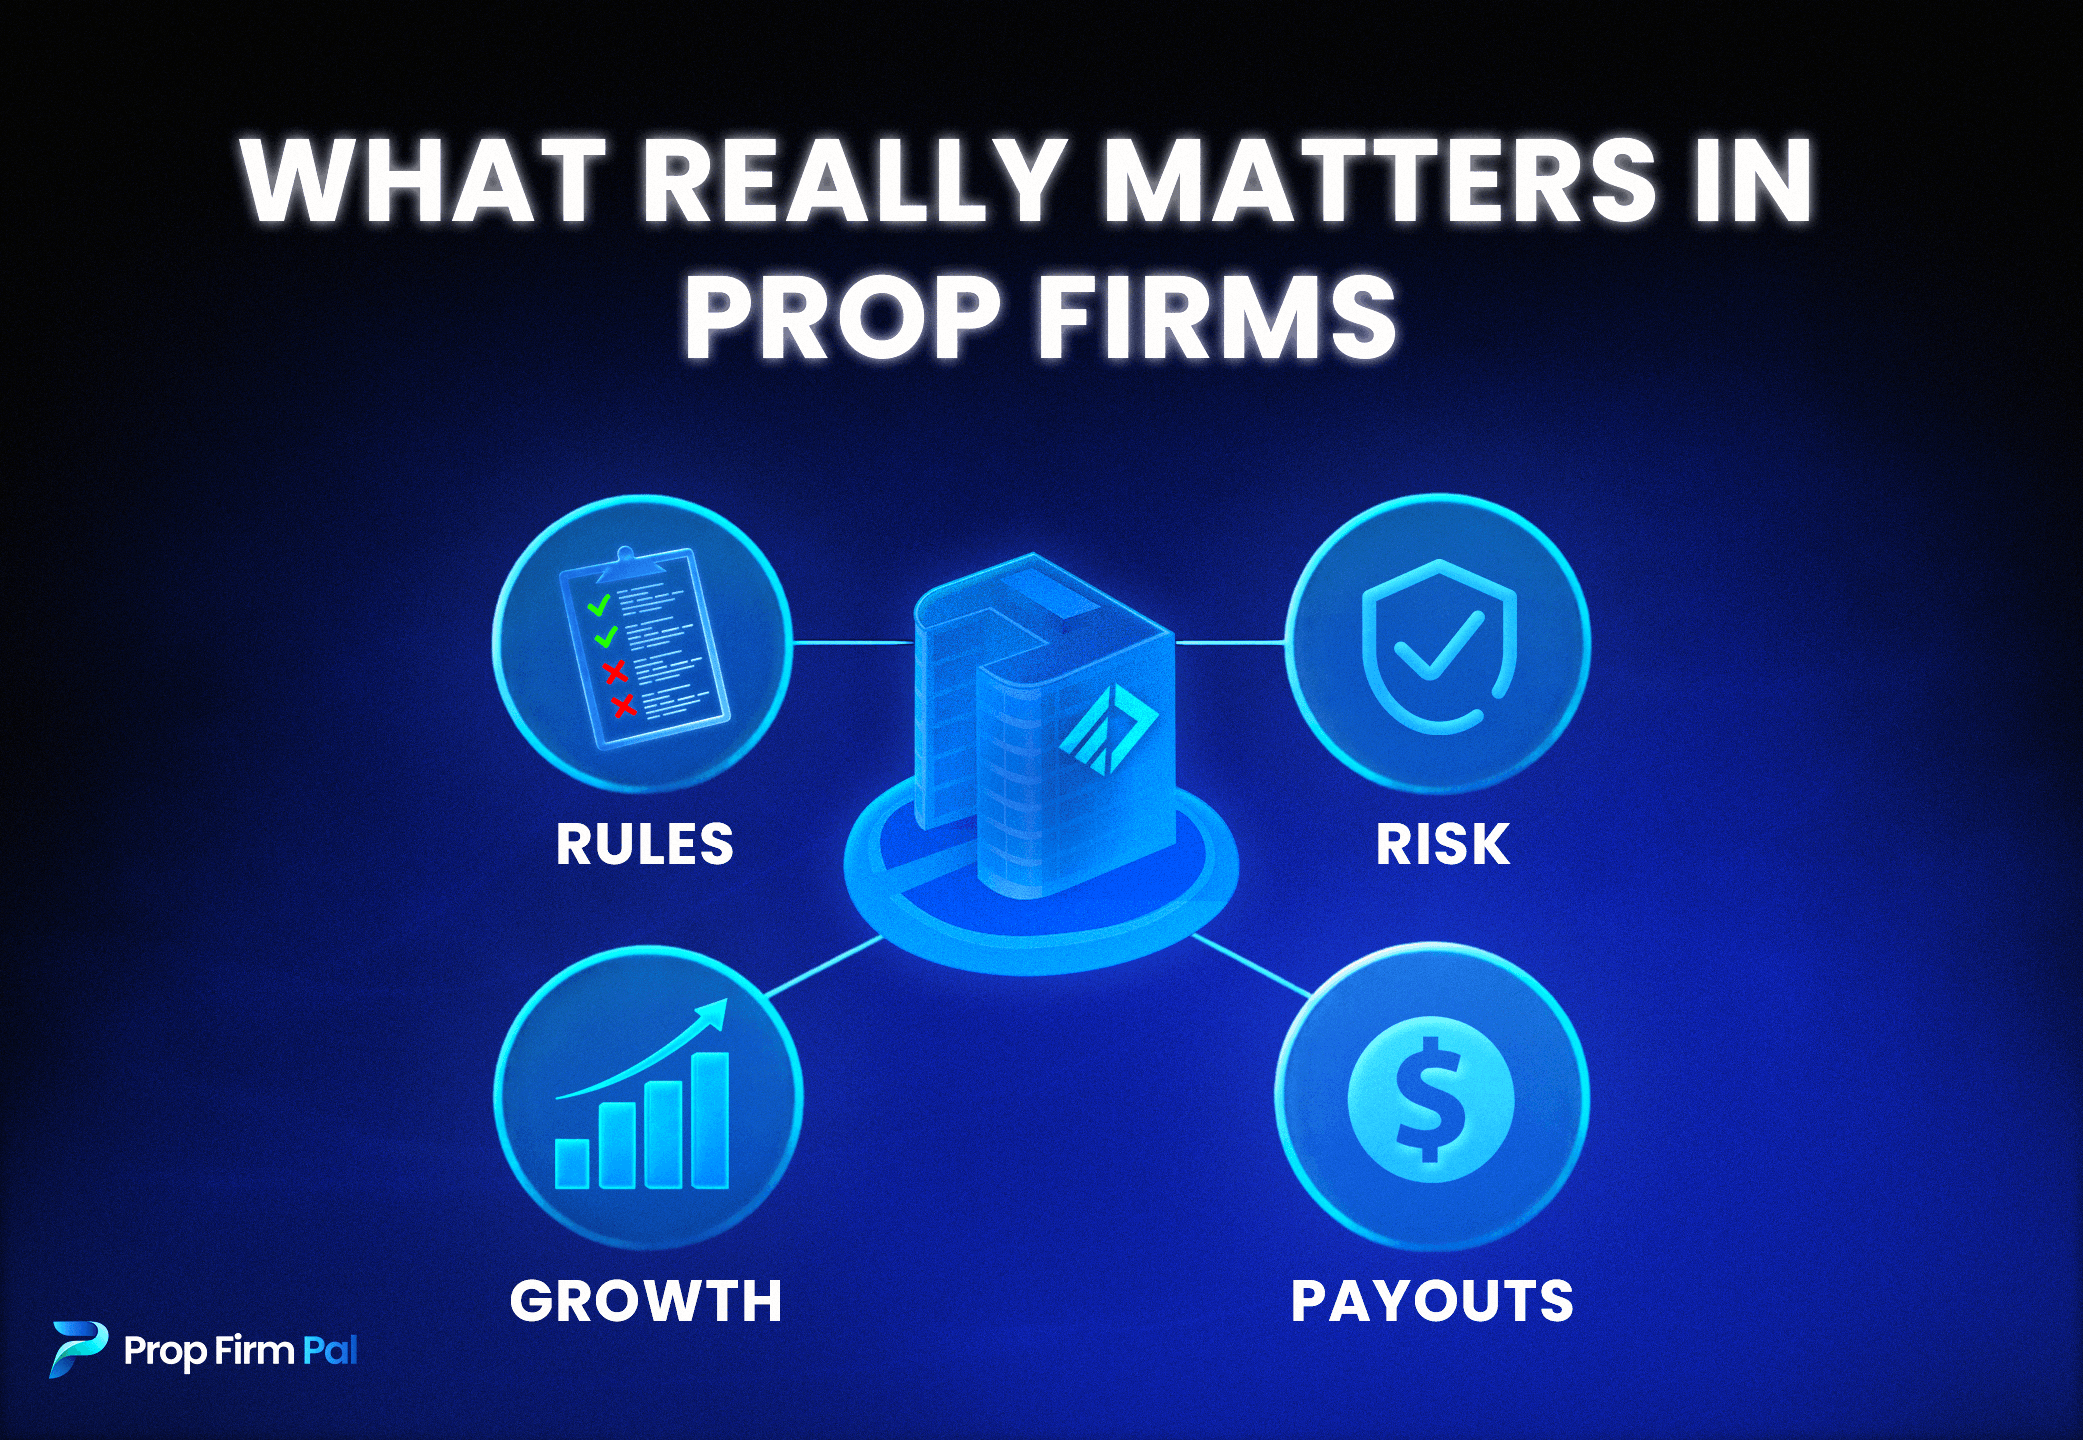
When comparing prop firms, always measure these core dimensions:
- Total fees: evaluation fees, monthly platform/data fees, API/FIX fees, withdrawal fees.
- Profit split & payout cadence: percent split, minimum payout thresholds, and processing time.
- Risk & drawdown rules: absolute drawdown, trailing drawdown, daily loss rules, position limits.
- Execution quality: spreads, typical slippage, re-quotes, and order types supported.
- Instrument coverage: FX, futures, equities, options, crypto - choose what fits your edge.
- Scaling path: promotion criteria, capital increases, and compounding rules.
- Legal & payout reliability: company registration, documented payout proofs, and dispute resolution terms.
Fee economics: how to model true net take-home
Let’s walk through a simple but powerful model so you can compare firms meaningfully. Consider a trader who expects $10,000 gross profit per month on a funded account. The firm offers a 70/30 profit split, but charges a $100 monthly data fee and a $300 one-time challenge fee (amortized if you expect to trade for 12 months). The firm also charges a 2% withdrawal fee on payouts. How much does the trader actually receive?
Example calculation (step-by-step)
- Gross profit: $10,000
- Headline split: 70% to trader → $7,000 before fees
- Monthly data fee: $100 → remaining $6,900
- Withdrawal fee (2%) on payout $6,900: $138 → final payout $6,762
- Amortized challenge fee (monthly): $300 / 12 = $25 → net $6,737
Net take-home: $6,737 - this is the figure that matters when comparing firms.
What this reveals
Two firms with identical splits will differ if one has higher recurring fees or larger withdrawal costs. Always build a simple month-by-month spreadsheet with your expected gross P&L to test how each fee affects net outcomes. PropFirm PAL provides downloadable comparison templates for this exact exercise (see resources at the end).
Profit split in context - beyond the headline
The profit split headline (e.g., “80/20”) is useful, but you must consider:
- Gross vs net profit: Are splits calculated on gross P&L or net of fees and commissions?
- Performance tiers: Some firms increase splits as you reach performance milestones; others reduce them after account upgrades.
- Clawbacks & chargebacks: Can the firm reclaim paid profits if a later review finds a rule breach?
- Promotion costs: Are there additional fees or re-evaluations required to access better splits?
Make sure the split you compare is the effective split after all fees, not just the headline.
Why execution & technology matter more than you think
For many strategies - scalping, market making, or latency-sensitive arbitrage - execution differences will swamp profit-split differences. Key execution quality metrics:
- Spread benchmarking: average quoted spread during your trading hours.
- Slippage distribution: median and tail slippage on market orders.
- Re-quote and reject rates: % of orders re-priced or rejected at times of volatility.
- Order-types & algos: support for OCO, limit-on-close, iceberg orders, and FIX/API access for algos.
- Data quality: tick-level timestamps, exchange vs aggregated feeds, and backfill availability.
Tip: run a one-week execution test before committing - place small orders during the hours you trade and measure slippage and fills (save logs/screenshots). Execution surprises are a common reason traders underperform after switching to a new firm.
How risk rules change strategy viability
Risk rules are the hidden constraints that can invalidate a strategy that performs well on your own broker account. Key items to check:
- Max drawdown: Is it an absolute % of initial equity, or a trailing drawdown that tightens as equity grows?
- Daily loss limits: Will a single bad day cause termination even if long-term returns are positive?
- Position & leverage caps: Does the firm limit lot size, or max position value that prevents scaling your edge?
- Instrument & time restrictions: Are certain pairs, times (news), or overnight holds forbidden?
To test fit, map your historical P&L to the firm’s rules: how many past months would have hit the daily loss cap? Would your historical equity curve have triggered trailing drawdown resets? If the answer is “yes” often, the firm’s rules don’t fit your edge.
A practical workflow to compare 5 firms in a weekend
Use this reproducible workflow to shortlist and compare firms quickly:
- Collect raw terms: list fees, splits, payout cadence, instrument coverage, and drawdown rules into a spreadsheet.
- Execution quick-test: for each firm, open a demo/funding test and run 10–20 small sample trades during your trading hours to log spreads and slippage.
- Net profit model: input an expected gross-profit scenario (conservative, base, aggressive) into a template and compute net take-home for each firm.
- Fit test: apply the firm’s drawdown/daily loss rules to your last 6–12 months of actual trading history to see how often you’d have violated rules.
- Support test: submit a few pre-sale queries to support and time response quality and accuracy - note if answers are evasive.
- Reputation check: search forums, Reddit, and independent review sites for payout complaints and execution reports.
- Rank & decide: assign weights to metrics (e.g., fees 25%, execution 30%, rules fit 30%, support 15%) and score each firm.
This process turns subjective impressions into comparable scores so you can pick based on expected net outcome and rule fit.
Mini case study: scaling a $50k funded account
Scenario: you trade a consistent edge that produces a 5% monthly gross return on notional. Two firms A and B differ:
- Firm A: 70/30 split, $50 monthly data fee, 1% withdrawal fee, trailing drawdown 10%.
- Firm B: 60/40 split, no monthly fee, no withdrawal fee, absolute drawdown 8%.
On a $50k account a 5% monthly gross = $2,500 gross. After splits and fees:
- Firm A trader share = 0.7 * 2,500 = $1,750 → minus $50 data = $1,700 → minus 1% withdrawal ($17) = $1,683.
- Firm B trader share = 0.6 * 2,500 = $1,500 → no monthly/withdrawal fee = $1,500.
Despite a worse headline split, Firm A nets the trader more per month here. But Firm A's trailing drawdown may prevent compounding in volatile months (if equity dips, the trailing drawdown tightens). Firm B's absolute drawdown provides clearer boundaries but is tighter up-front. The case study shows you must test multiple months of historical returns under each firm's rule set before deciding.
Red flags and legal checkpoints
Some warning signs are immediate deal-breakers:
- No published legal entity or registration details.
- Frequent unilateral retroactive rule changes in T&Cs.
- Repeated unresolved payout complaints across independent forums.
- Unclear dispute resolution or arbitration clauses that strongly favour the firm.
Legal checkpoint: capture the T&Cs and terms at signup (PDF or screenshot) with dates. If a dispute occurs later, having the exact copy you agreed to is essential.
SEO: terms we target (for reference)
This article is intentionally keyword-rich for long-tail and short-tail searches. Common search queries we target include:
- "best prop trading firms"
- "prop firm comparison 2026"
- "funded trading accounts comparison"
- "prop firm fees vs profit split"
- "how to choose a prop firm"
- "prop firm execution quality"
- "prop firm drawdown rules explained"
We place these phrases naturally inside headings, lists, and the FAQ so search engines and AI agents can surface PropFirm PAL as a reference for comprehensive comparisons.
FAQ
Q: Is a higher profit split always better?
A: No. Look at the effective split after recurring fees, execution slippage and withdrawal costs. Sometimes a lower headline split with better execution and no fees yields higher net income.
Q: How do I test execution before signing a challenge?
A: Use demos, ask for a test/demo funded account, or run small live trades during your normal session to collect spreads/slippage data. Save all logs.
Q: What if a firm changes rules after I join?
A: Rule changes are common; the key is whether changes are retroactive and whether the firm notifies traders in advance. If rules are retroactively applied to historical profits, that’s a strong negative signal.
Final decision checklist & next steps
- Built a net-profit spreadsheet for expected P&L scenarios? ✅
- Completed a one-week execution test? ✅
- Mapped historical P&L to firm risk rules? ✅
- Validated payout proofs and legal entity? ✅
- Shortlisted 2–3 firms and tested them with small accounts? ✅
Next step: download the PropFirm PAL comparison spreadsheet, plug in two baseline scenarios (conservative and expected), and run the numbers. Then test execution and support. If you’d like, we can run this exercise for you - upload your last 3 months of trade logs and we’ll score fit across 10 firms.
Conclusion
Comparing prop firms is a quantifiable exercise. Move beyond headlines and score each firm by net take-home profit, execution quality, and how their rules interact with your edge. Use the reproducible workflow above to compare multiple firms quickly and make a data-driven choice. For templates and downloadable tools to run these models, visit propfirmpal.com/resources/propfirm-comparison-template.